

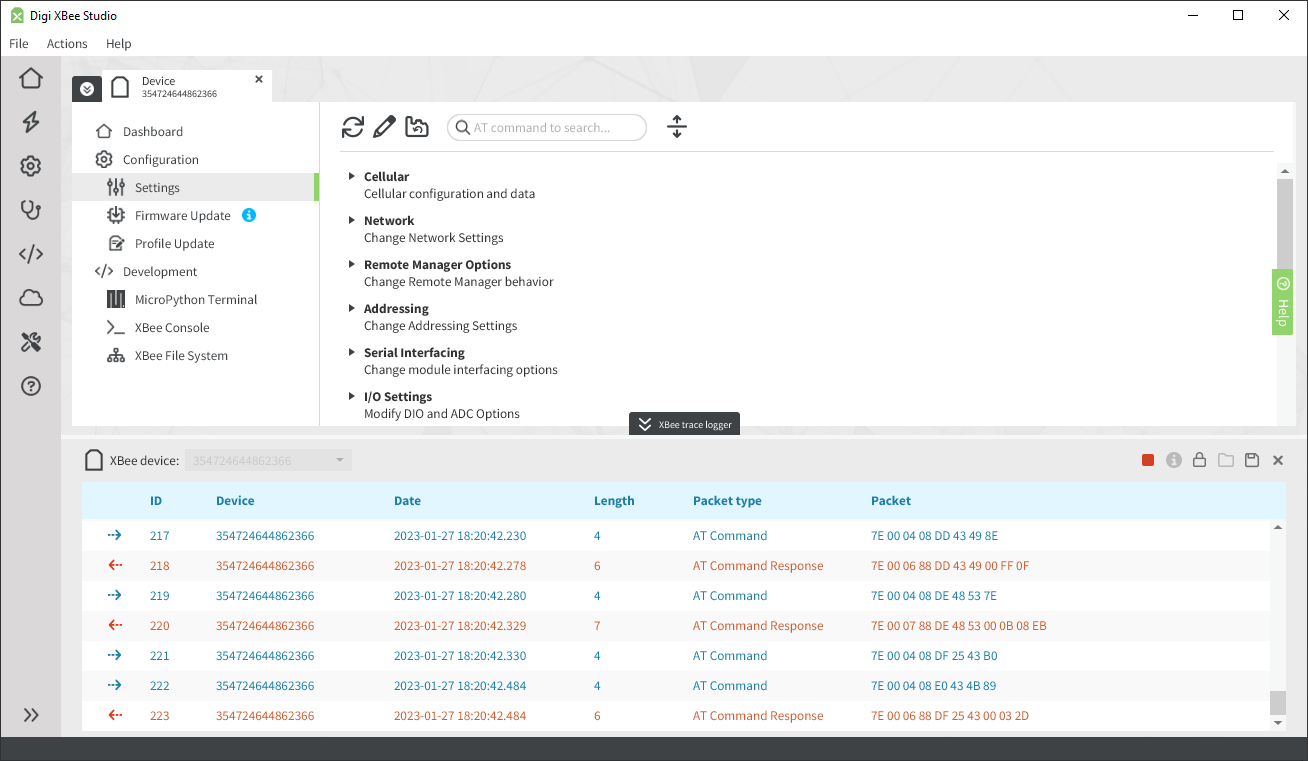
This tool allows you to inspect and analyze all XBee API packets that are sent and received by one or several XBee devices. It is located in the bottom part of the application and can be expanded and used at any time while working with other parts of XBee Studio.
| This tool only works with XBee devices in API or API escaped mode. If your device is configured in a different mode, the XBee trace logger will not capture and show any packet. |
Start XBee packets capture
To start capturing XBee packets of an XBee device, follow these steps:
-
Click the XBee trace logger button located at the bottom of the application to expand the tool.
-
Select the XBee device you want to capture packets from in the left selector. If you want to capture packets from all XBee devices, select All devices.
-
Click the Start XBee packets capture button
 .
.
Inspect the XBee packets
Once the trace logger captures some packets of the selected XBee device, you can inspect them to get detailed information:
-
Select the packet you want to inspect.
-
Click the Show detailed information of the selected packet button
 .
.
The packet details dialog opens showing the different parts of the API packet.
Stop XBee packets capture
To stop capturing XBee packets, click the Stop XBee packets capture button ![]() .
.