

This view allows you to analyze the radio spectrum used by your XBee device. The tool measures the noise level on each RF channel and displays its best, worst, and average values.
1. Analyze the spectrum
Click the Start spectrum analysis ![]() button to begin the analysis.
The analysis ends after 60 seconds, but you can change the duration and the sampling interval by clicking the Configure spectrum analysis
button to begin the analysis.
The analysis ends after 60 seconds, but you can change the duration and the sampling interval by clicking the Configure spectrum analysis ![]() button.
You can also stop the analysis at any time by clicking the Stop spectrum analysis
button.
You can also stop the analysis at any time by clicking the Stop spectrum analysis ![]() button.
button.
When the analysis starts, the chart and channel list display the RF channels supported by the XBee device:
-
The chart displays the noise level for all the RF channels.
-
Each channel is represented by a bar showing the current noise level, with two little markers indicating the highest (blue) and the lowest (red) noise levels.
-
A black line represents the overall average noise level across all channels.
The spectrum analyzer continuously updates the noise levels until the analysis ends or is stopped.
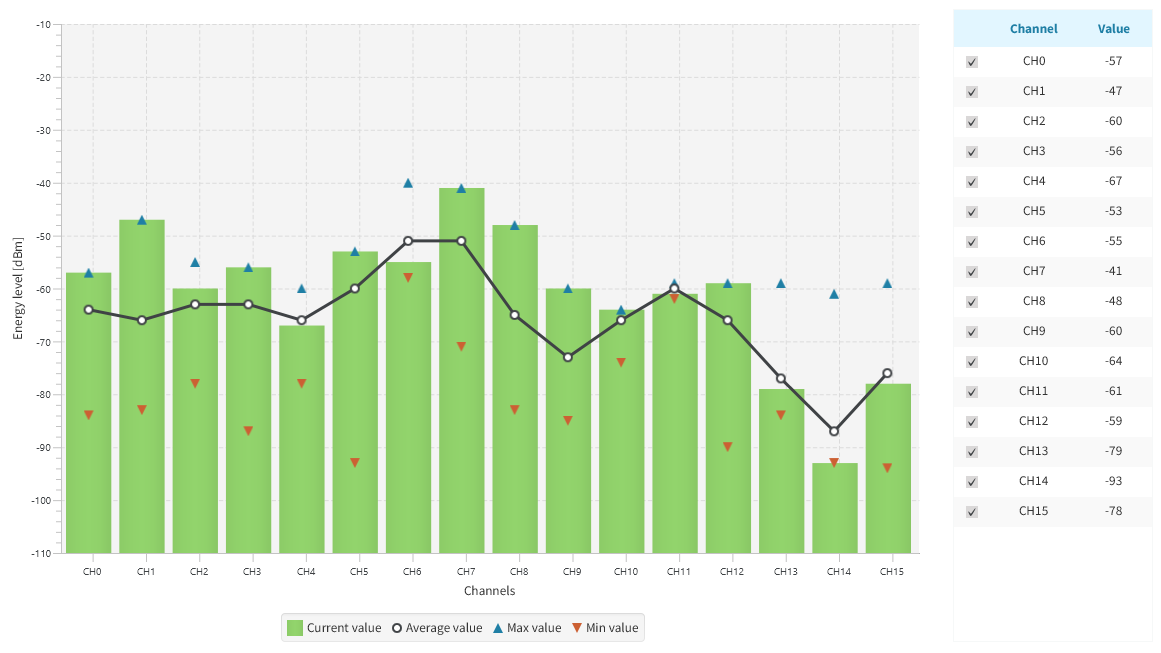
Use the legend filters to show or hide the bars, best and worst noise level values, and the average noise line.
You can also hide individual channels by selecting or clearing their checkboxes in the channel list on the right.
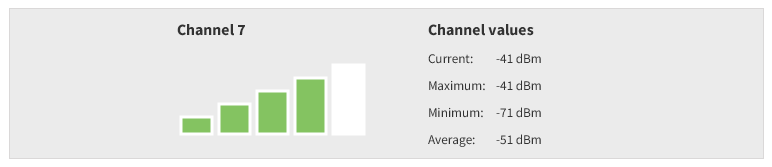
Clicking a channel in the chart or channel list displays displays detailed information for that channel, including its current, average, best, and worst noise levels.
The right panel shows the total number of noise level samples collected by the XBee device.
2. Export the analysis results
When the spectrum analysis is complete, you can export the results in CSV format by clicking the Export spectrum analysis ![]() button in the toolbar.
button in the toolbar.