

This view allows you to discover and visualize the topology of the network your XBee device is connected to.
| For XBee modules, the Network Topology view is available only when your device operates in API mode. If not, XBee Studio prompts you to switch the mode before discovering the network. |
When you open the Network Topology view for the first time, XBee Studio automatically starts a continuous network discovery using the selected XBee device.
You can stop the process at any time by clicking the Stop network discovery  button, and resume it by clicking the Start network discovery
  button in the toolbar.
While the network discovery is running, the right side of the toolbar displays network information based on the XBee protocol, such as PAN ID, channel, network name, and device count, along with the number of scans performed and the elapsed time since the discovery began.
Remote devices are dynamically added to the panel as they are found and can be displayed in two layouts:
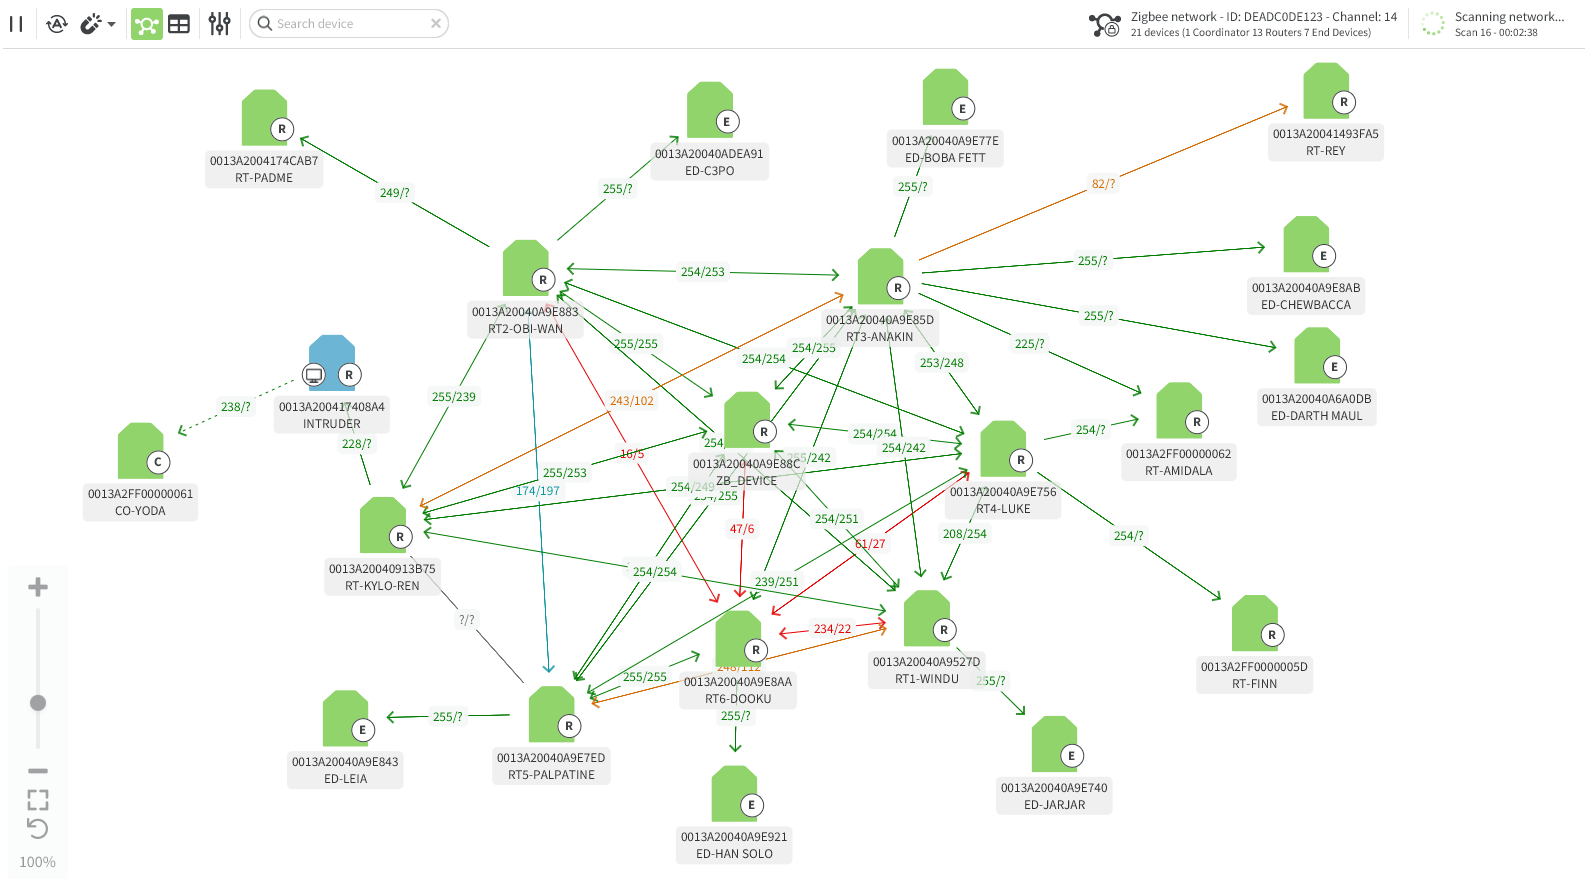
Graphic view
By default, XBee Studio displays devices as nodes. Remote devices are shown in green, while the local device is shown in blue.
The information displayed for each node depends on the protocol:
-
Wi-SUN: IPv6 mesh address and name.
-
Other protocols: 64-bit address, name, and role.
|
If you are in the table view, click the Switch to graphic view |
When hovering over a device, XBee Studio displays shortcut buttons for the most common operations. You can also click the device to open its Dashboard if remote communication is supported.
Each node is connected to its neighbors with:
-
Solid lines for active connections
-
Dotted lines for undiscovered connections
-
Arrows indicating the communication direction
-
Line color representing the link quality, also shown numerically at the center of the line
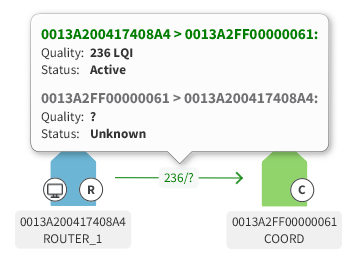
Click a line or its label to view detailed information about the connection in both directions.
Depending on the XBee protocol, link quality is displayed as follows:
-
Zigbee: Link Quality Indication (LQI), ranging from 255 (strongest) to 0 (weakest).
-
DigiMesh: Signal strength in decibel-milliwatts (dBm), ranging from 0 (strongest) to -100 (weakest).
-
802.15.4: XBee Studio does not display link quality between nodes; only nodes within RF range of the local device are shown.
-
Wi-SUN: XBee Studio does not display link quality between nodes.
|
When a device leaves the network, some neighbors retain information about their previous relationship. If you perform a new discovery, these devices may reappear but remain unreachable if you attempt to verify the connection. Such devices are grayed out and cannot be used. |
Visualization settings
When in the graphic view, you can adjust several display settings:
-
Pan and zoom: Drag to move around the view area.
Zoom in or out with the mouse wheel or the slider at the bottom-left corner of the view.
You can also center the view on all devices
 or reset it to the default zoom level
  .
. -
Auto layout: When enabled, devices are automatically arranged dynamically in real time (enabled by default).
-
Device separation: Adjust the spacing between devices.
-
Search device: Search for devices in the network by entering part or all of their address, name, or role in the search box.
Table view
XBee Studio can also display discovered devices in a table format, which is useful for large networks or when you prefer a structured list view.
To switch from the graphic view, click the Switch to table view ![]() button in the toolbar.
button in the toolbar.
As in the graphic view, the table view shows basic information for each device and allows you to interact with common functionality. Each row also includes a button to view the device’s connection list.
| You can click any device in the table to open its Dashboard if remote communication is supported. |