Change the time interval for a graph
You can show the graph data in different time intervals, choosing from the default set shown as buttons above each graph or by using the slider under the graph to zoom in or out on a specific time frame. Changing the time interval in one graph changes it for all graphs. By default, the graphs show data collected over the last three days.
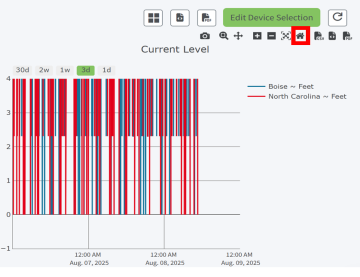
Reset graphs to the default time interval
To reset the graphs to the default of three days, hover over a graph to display the graph toolbar. Click the Home icon in the toolbar above graph.
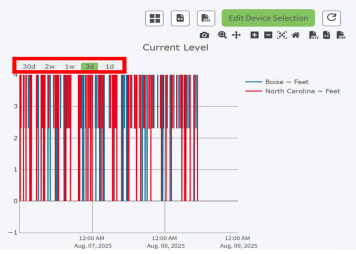
Use the time interval buttons
Click a time interval button above a graph to change the time interval in all the graphs. A day begins at 12:00 a.m.
-
30d: Display the last 30 days of data.
-
2w: Display the last 14 days of data.
-
1w: Display the last 7 days of data.
-
3d: Display the last 3 days of data. This is the default.
-
Today: Display the data from the current day.
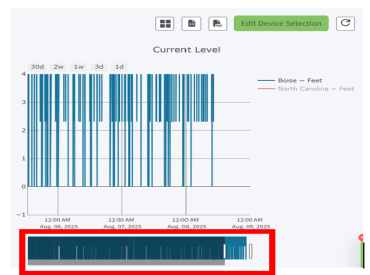
User the slider under a graph to zoom in or out
You can use the slider under each graph to zoom in or out. This feature is useful if you want to review date for a particular date or time frame that is not represented by the time interval buttons.
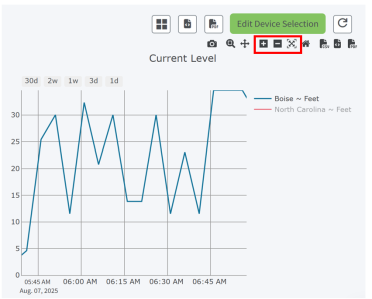
Display data in increments measured by hours or minutes
You can use the zoom buttons in the graph toolbar to zoom in or out on the graph. This feature is useful if you want to reduce the time interval to a certain hour or minute.
 PDF
PDF


