View automation data in the Automation Dashboard
The Automation Dashboard page graphically represents the information gathered by your devices. Each section in the page represents a control group created in the Automation Control page.
-
If you have logged into a Z45 Controller, click Admin Main.
-
From the Options section, click Applications. The Available Applications page displays.
-
Click Automation Dashboard. The Automation Dashboard page displays.
-
Connect Sensor: The last date and time that the device woke and pushed data to Digi Axess displays in the right side of the page. The data displayed on the page reflects the most recently collected data.
-
Z45 Controller: The data displayed on the page reflects the most recently collected data. When the Refresh option is selected, the data is automatically updated at the refresh interval defined in the Auto-Refresh option in the Device Profile page.
-
-
Determine the data monitoring sections you want to display on the page by selecting an option from the list box. The information in each section is dependent on the device.
-
Show all: Show all of the available information. This is the default.
-
System Status: Show hardware information.
-
Network Status: Show cellular network information.
-
Device-specific automation groups: Any automation that has been programmed to collect data from the device displays as an option. This is user-defined.
-
-
Determine the display style. Options are:
-
Details: Show a list of the monitoring data.
-
Overview: Show the data as a graphic.
-
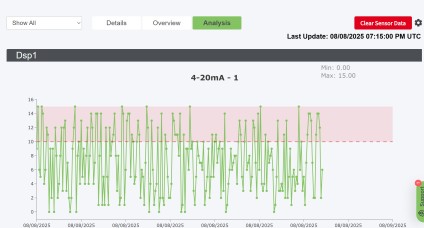
Analysis: Show a graph of the data over time collected for each pin. This is available only for data that changes over time. Roll the cursor over data to view the date details.
-
Connect Sensor+ only: If you have set a threshold for a pin, the threshold configuration is represented in the graph.
-
-
-
Click Refresh at the bottom of the page to refresh the data.
 PDF
PDF


