Use intelliFlow to display data usage by host over time
To generate a chart displaying a host's data usage over time:
Web
- If you have not already done so, enable intelliFlow. See Enable intelliFlow.
- From the menu, click Status > intelliFlow.
- Click Host Data Usage Over Time.
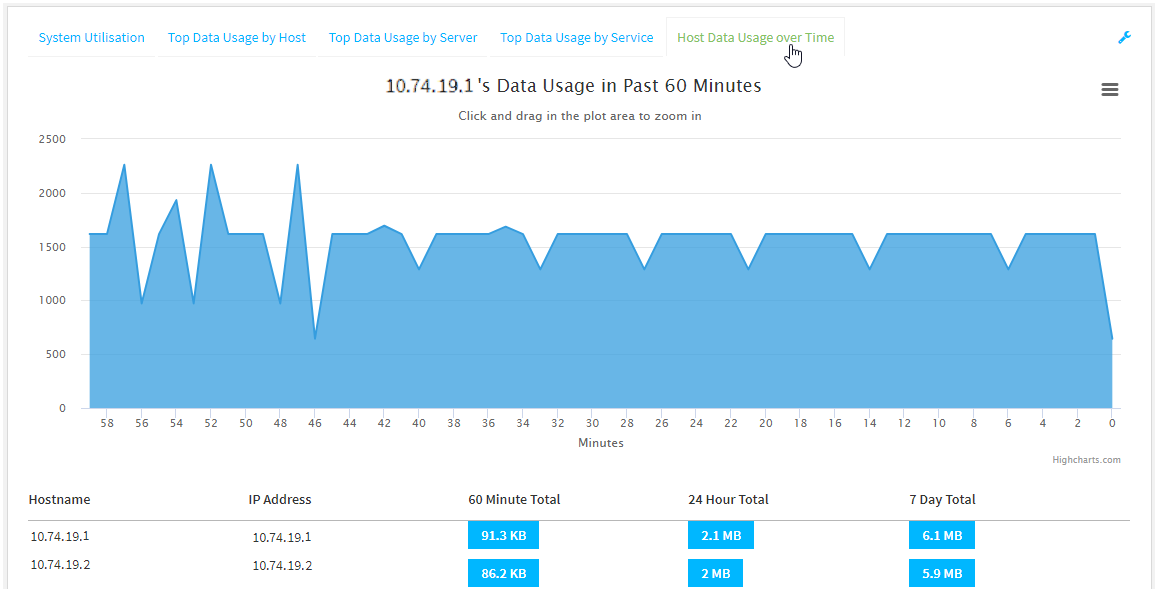
- Display more granular information:
- Click and drag over an area in the chart to zoom into that area and provide more granular information.
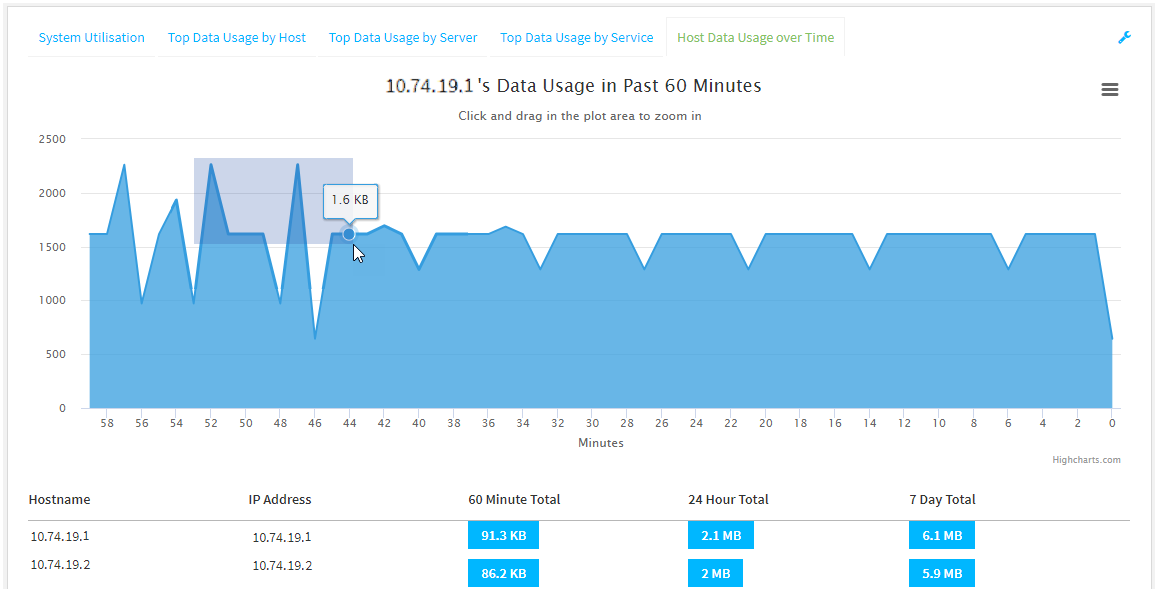
- Release to display the selected portion of the chart:
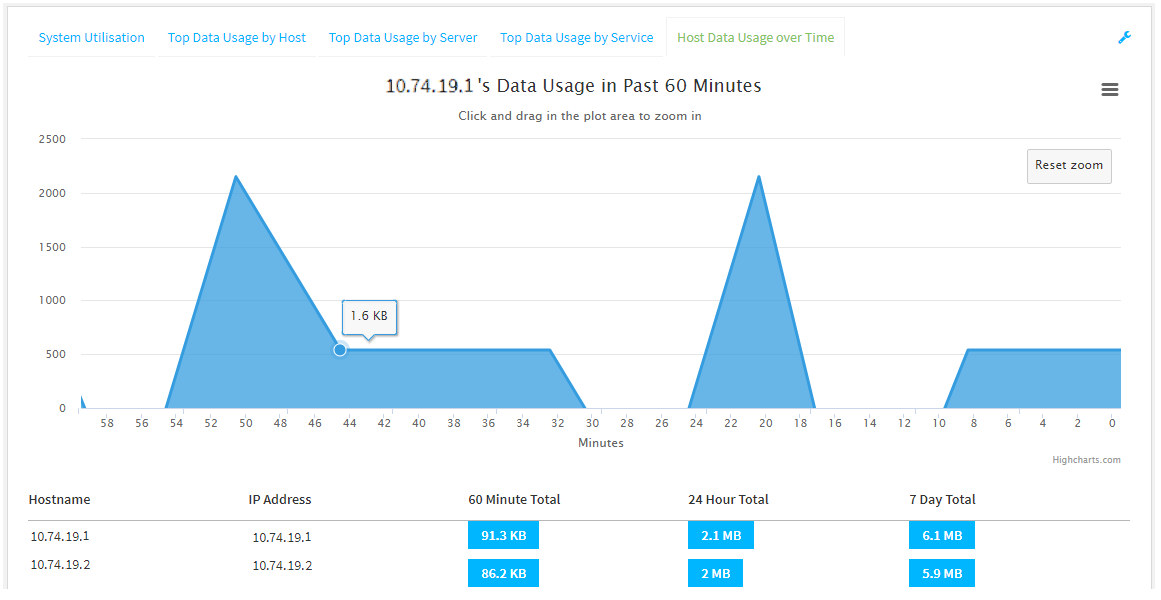
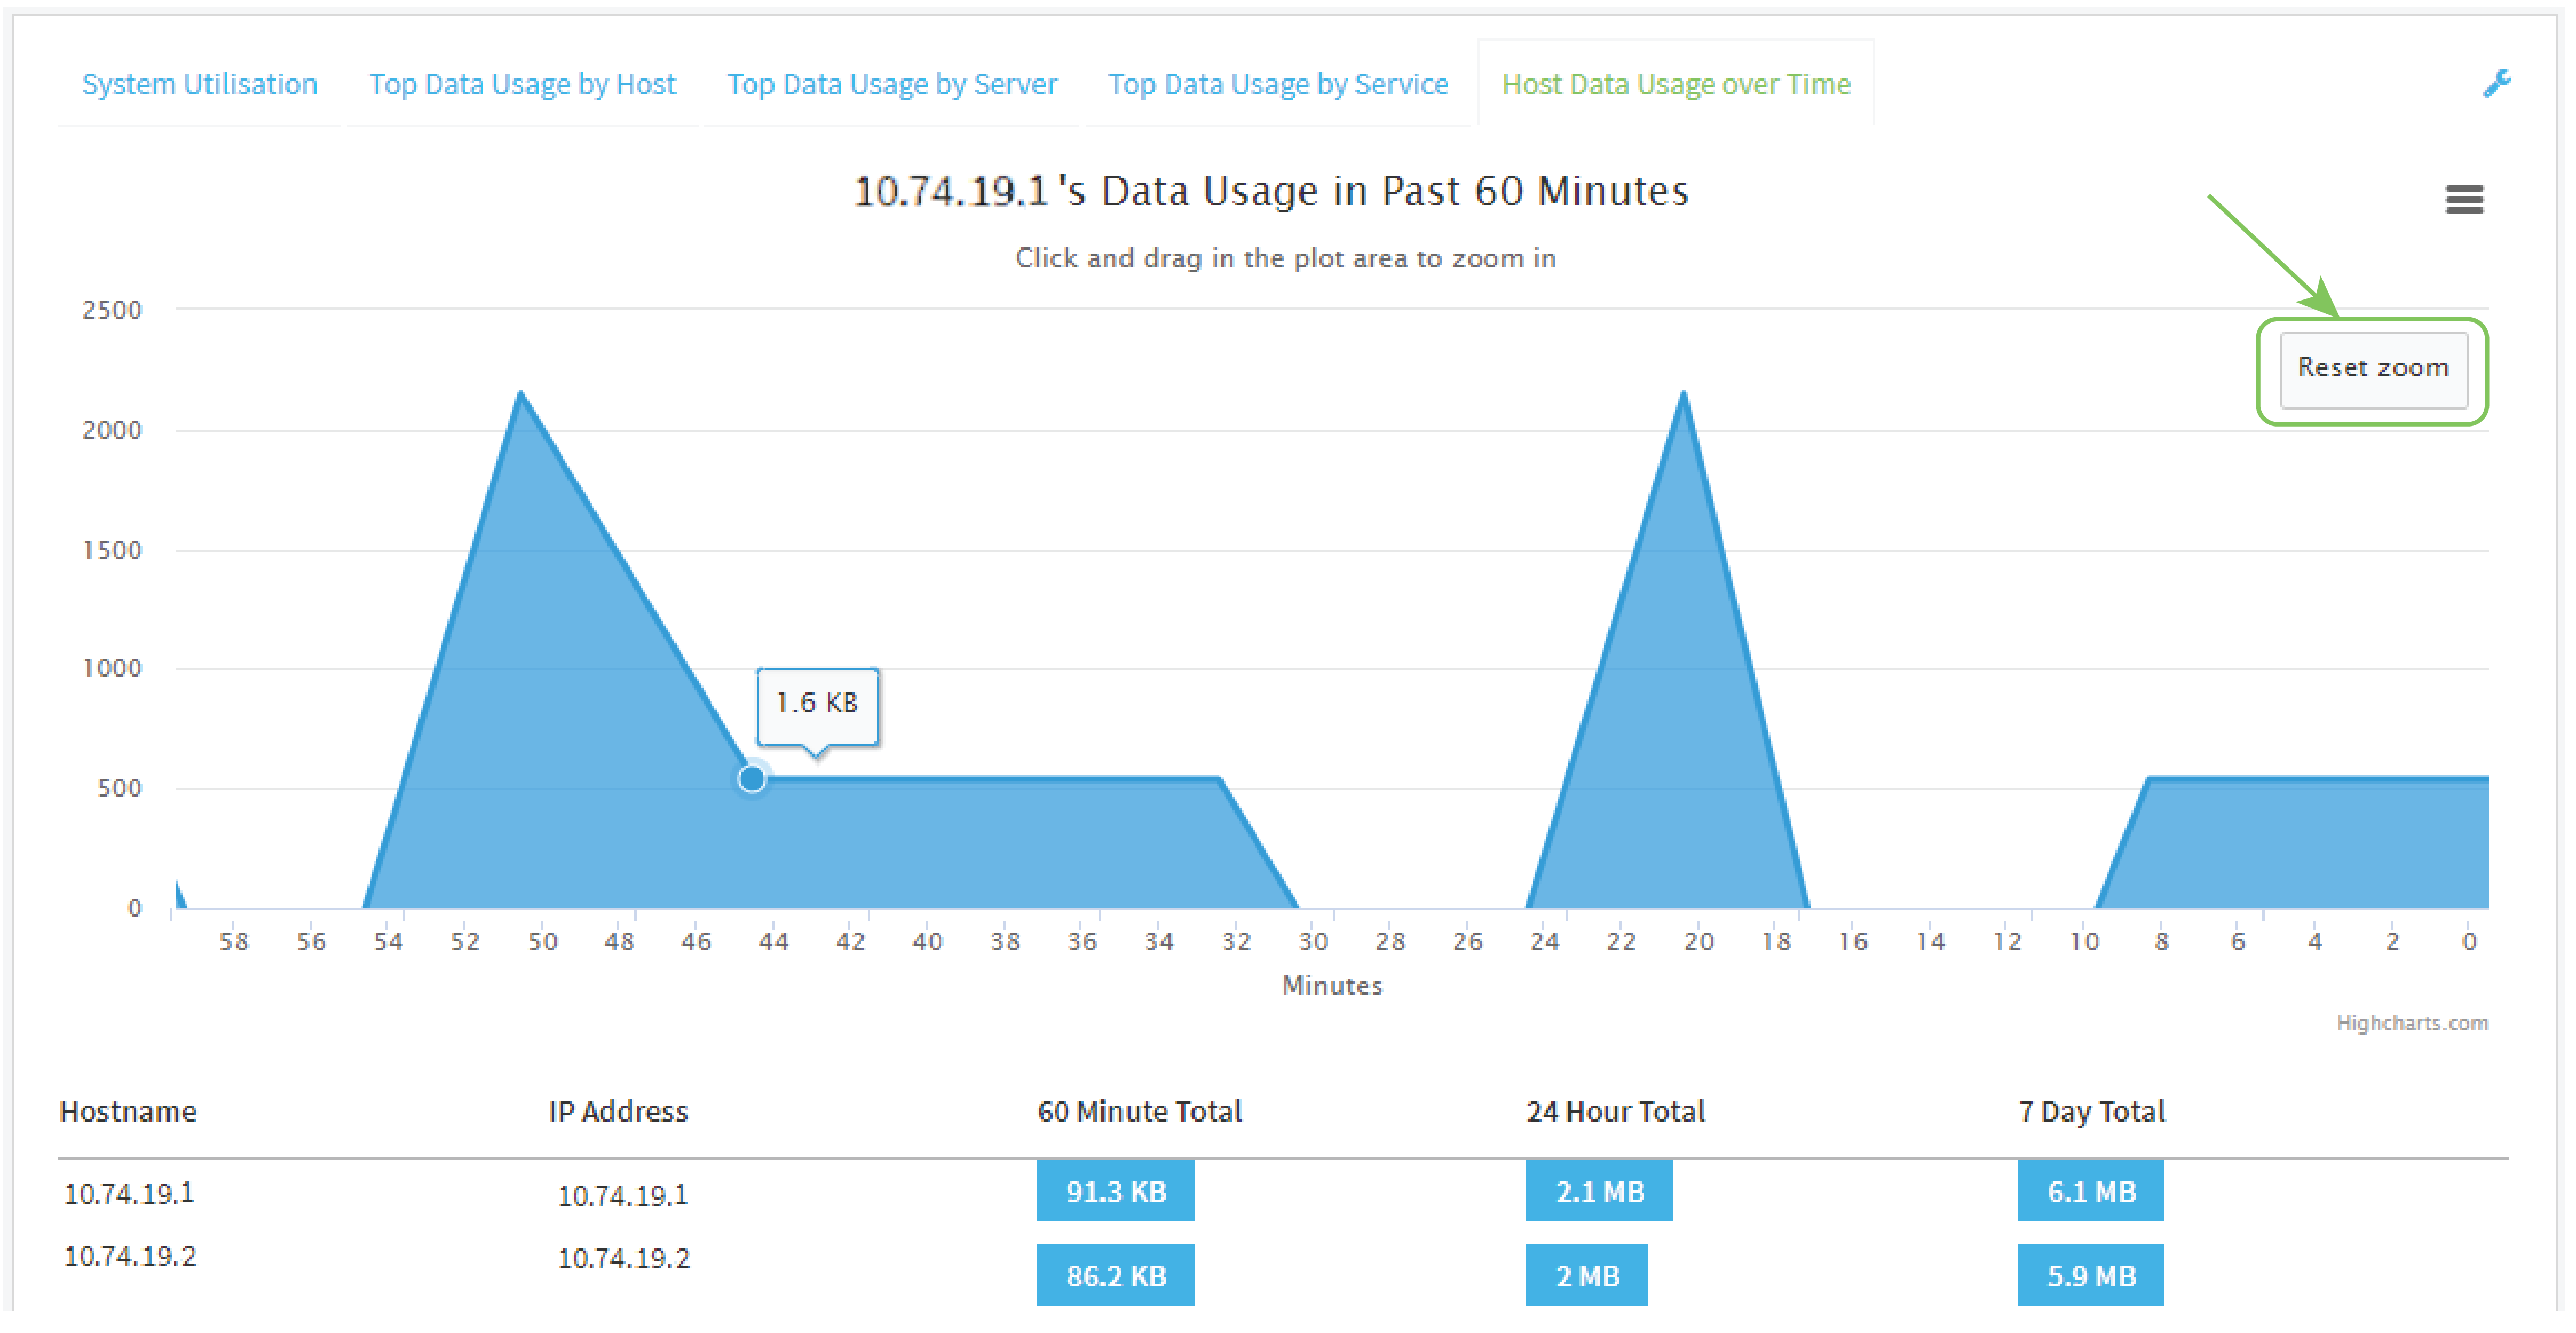
- Click Reset zoom to return to the original display:
- Click and drag over an area in the chart to zoom into that area and provide more granular information.
- Save or print the chart.
- Click the menu icon ().
- To save the chart to your local filesystem, select Export to PNG.
To print the chart, select Print chart.
- Display more granular information:
Log into the Connect EZ 4/4i WebUI as a user with full Admin access rights.
 PDF
PDF


