Use intelliFlow to display top data usage information
With intelliFlow, you can display top data usage information based on the following:
- Top data usage by host
- Top data usage by server
- Top data usage by service
To generate a top data usage chart:
Web
- If you have not already done so, enable intelliFlow. See Enable intelliFlow.
- From the menu, click Status > intelliFlow.
- Display a data usage chart:
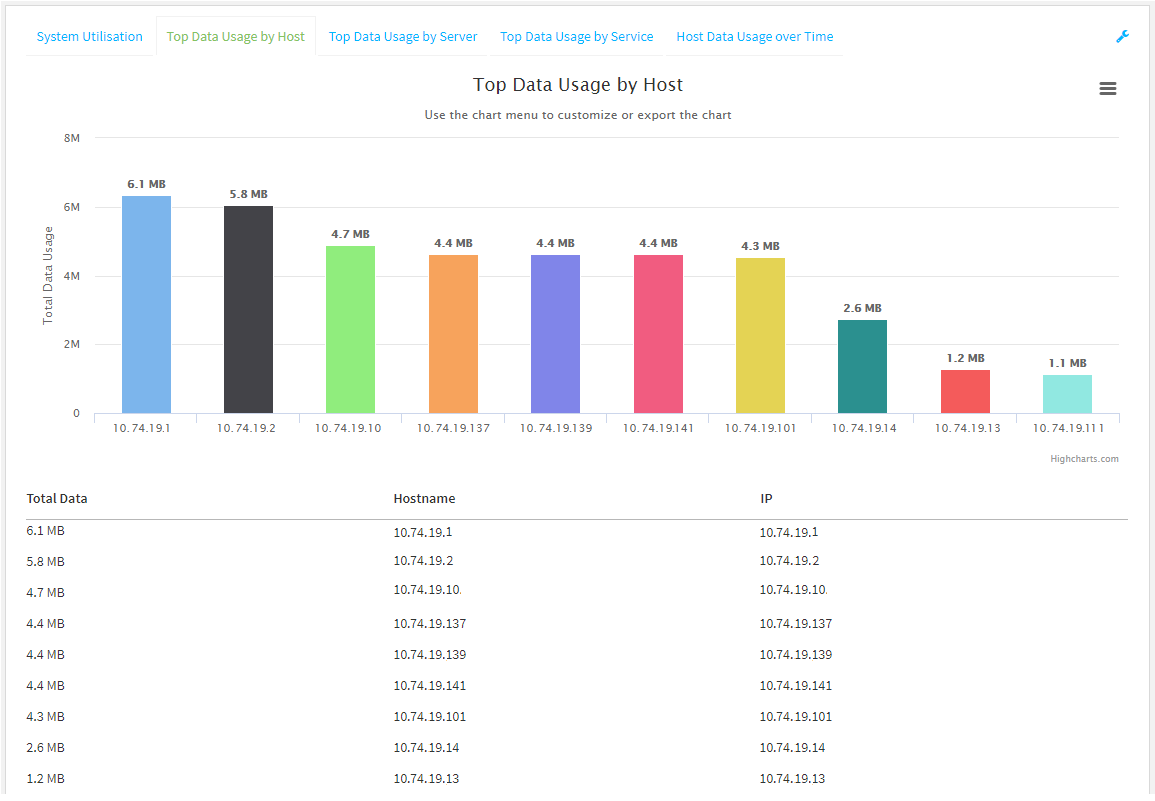
- To display the Top Data Usage by Host chart, click Top Data Usage by Host.
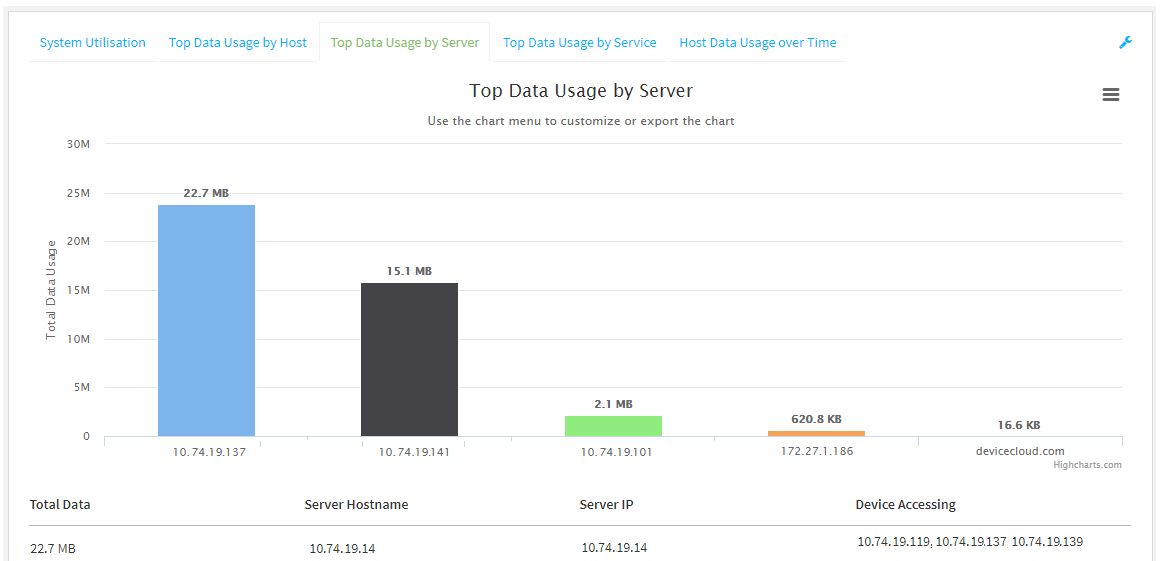
- To display the Top Data Usage by Server chart, click Top Data Usage by Server.
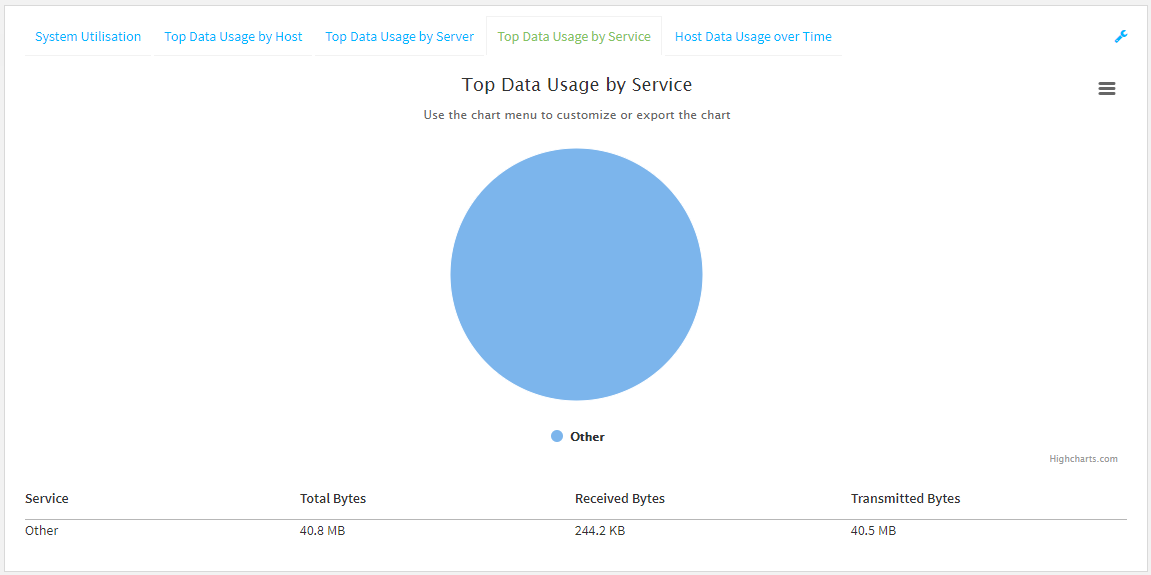
- To display the Top Data Usage by Service chart, click Top Data Usage by Service.
- To display the Top Data Usage by Host chart, click Top Data Usage by Host.
- Change the type of chart that is used to display the data:
- Click the menu icon ().
- Select the type of chart.
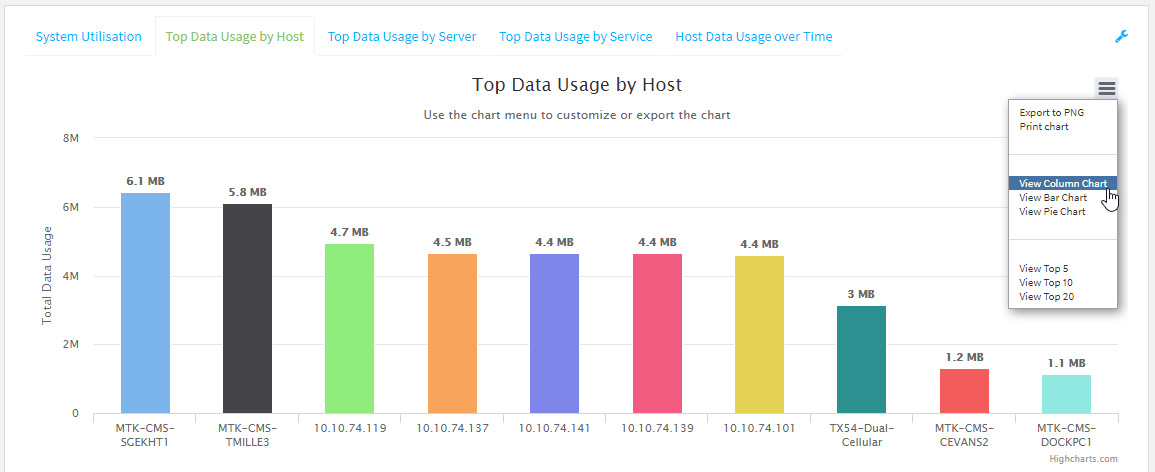
- Change the number of top users displayed.
You can display the top five, top ten, or top twenty data users.
- Click the menu icon ().
- Select the number of top users to displayed.
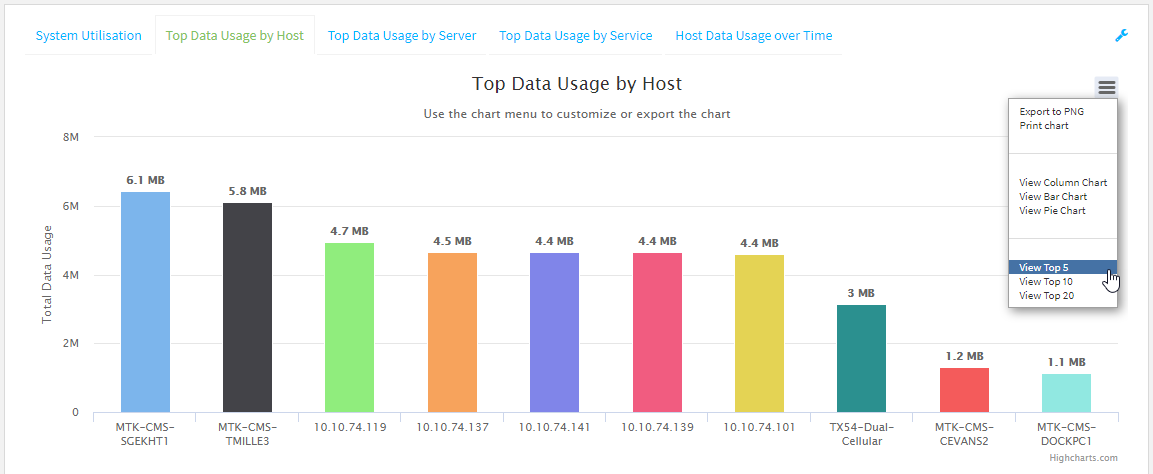
- Save or print the chart.
- Click the menu icon ().
- To save the chart to your local filesystem, select Export to PNG.
To print the chart, select Print chart.
Log into the IX20 WebUI as a user with full Admin access rights.
 PDF
PDF


