Review the demo application dashboard
The first time the demo application opens, the demo application dashboard is empty. After the application discovers all available data endpoints, and optionally subscribes to them, the dashboard populates with data endpoints.
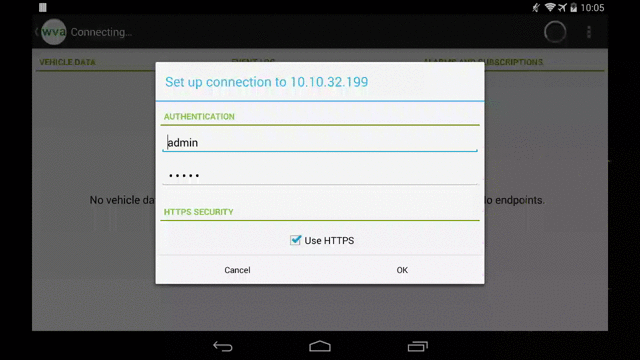
The animation below demonstrates this.
The dashboard has three panels:
- Vehicle Data: Displays the most recent vehicle bus data for which subscriptions have been made.
- Event Log: Displays a log of vehicle bus data updates and alarms sent over the Event Channel.
- Alarms and Subscriptions: Displays all vehicle bus data endpoints, which can be subscribed to or set for alarms.
You can also see a graph view that plots several endpoints. See Show graph view.
 PDF
PDF


