Debug remote applications
To remotely debug your application:
- Create a new connection to your target, if you do not yet have one:
- Click the New Connection combo box in the toolbar or select Target > New Connection. The New Connection wizard opens.
- Select Generic Connection. Click Next.
- Click Browse to look for targets. The Select Target dialog opens. It lists all the targets in the neighborhood with their corresponding IP.
- Select your device. Click OK.
- You can also change the default connection name, TCF Agent, in the Connection Name text box.
- Click Finish to create the connection.
- Click the Connect button
 , next to the combo box in the toolbar, if it is not already connected.
 - Create a launch configuration:
- Select the project to launch in the Project Explorer view.
- Go to Run > Debug Configurations. The Debug Configurations dialog opens.
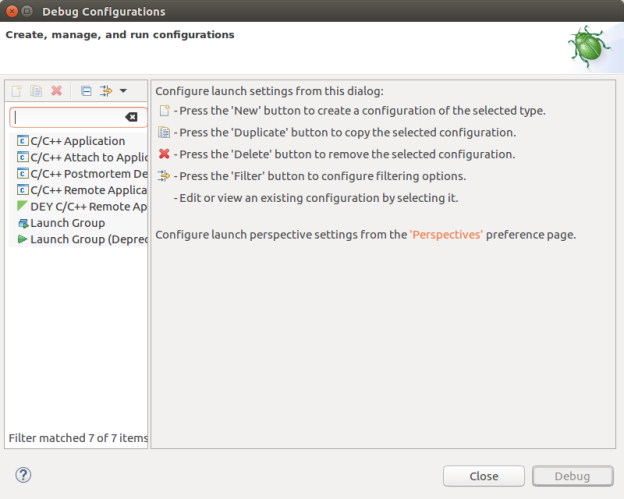
- Double-click the DEY C/C++ Remote Application category from the list on the left. A new launch configuration is created for your project. By default, all the required settings are automatically filled but you can modify them in their corresponding tab. Missing parameters or bad configuration errors are displayed in the message area at the top of the dialog.
- Click Apply to save the launch configuration.
Note You can also use the Debug As > DEY C/C++ Remote Application shortcut from the context menu of the Project Explorer view.
- Remotely debug the application:
- Click Debug in the Debug Configurations dialog to start the debug process. The application is automatically transferred to the target and executed.
- Eclipse asks whether to switch to the Debug perspective. Click Yes.
The Debug perspective has a layout oriented to debugging. It displays several views to help you during the debug process:
- Code editor displays the execution instruction and add/remove breakpoints.
- Debug view lists the current process and their threads.
- Variables view allows you to inspect or change the program variable values.
- Breakpoints view lists all the breakpoints and allows you to enable/disable or remove them
- Terminal view lists the input/output of the application being debugged.
- Debugger console displays the gdb output and allows you to interact with it by sending commands.
- You can control your debug execution using the debug toolbar buttons:
- In the Debug view, select a thread.
- To control the debug session, you can click:
- Resume (F8) resumes a suspended thread.
- Suspend halts the execution of the selected thread.
- Terminate (Ctrl + F2) ends the selected debug session and/or process.
- Disconnect detaches the debugger from the selected process.
- Step Into (F5) steps into the highlighted statement.
- Step Over (F6) steps over the highlighted statement. Execution continues at the next line in the same function.
- Step Return (F7) returns from a function which has been stepped into.
- Instruction Stepping Mode opens the Disassembly view. This view let you examine the program as it steps into disassembled code.
Note For more information, see the "C/C++ Development User Guide" at http://help.eclipse.org/index.jsp.


